This project originated through consulting work with the Master’s in Statistical Practice (MSSP) program at Boston University, where I served as a PhD Senior Consultant. In this role I led teams of 5 Master’s students from client intake through modeling decisions, final write-ups, and presentations. This work resulted in a peer-reviewed publication in the American Journal of Otolaryngology (Amador et al., 2023)
I was brought on as a lead statistician for a rapid-turnaround consulting engagement — the research team needed results within two weeks. The project was a systematic review and meta-analysis examining whether neuromodulating drugs reduced cough symptoms in patients with Chronic Airway Hypersensitivity (CAH), a condition diagnosed in patients whose chronic cough persists after all other causes have been ruled out. Three outcomes were of interest: cough frequency (coughs per hour), cough severity (Visual Analog Scale, 0–100), and cough-related quality of life (Leicester Cough Questionnaire, LCQ).
Importantly, the researchers were not setting out to demonstrate that these drugs work. The goal was to assess whether the existing evidence base was sufficient to support their widespread off-label use — and to make the case that a properly powered randomized controlled trial is still needed.
Of 999 abstracts screened, 6 studies met clinical inclusion criteria. However, a further comparability issue emerged at the analysis stage: of the 6 studies, 3 reported cough frequency as a geometric mean and 3 as an arithmetic mean. These are not directly comparable — pooling across them would produce a meaningless estimate.
This required a methodological decision: which reporting standard to adopt. We chose to pool the geometric mean studies, as the geometric mean is the more appropriate summary for right-skewed count data like coughs per hour. The arithmetic mean studies were excluded from the meta-analysis on this basis, reducing the final set to 3 studies.
This is a common and underappreciated challenge in meta-analysis. Exclusions at this stage have nothing to do with study quality — the excluded studies may be perfectly well-conducted — but with the simple fact that clinical literature is not written with pooled analysis in mind. Researchers choose outcome reporting conventions for their own purposes, and those choices can render otherwise eligible studies incomparable.
Additionally, some studies had missing standard errors, which are required for inverse-variance weighting. We performed sensitivity analyses on these to assess how assumptions about missing variance affected the pooled estimates.
Decisions about clinical inclusion were delegated to the otolaryngologists on the team–I’m certainly not qualified to determine whether two drugs are comparable! My focus was on the statistical comparability of studies that passed clinical screening.
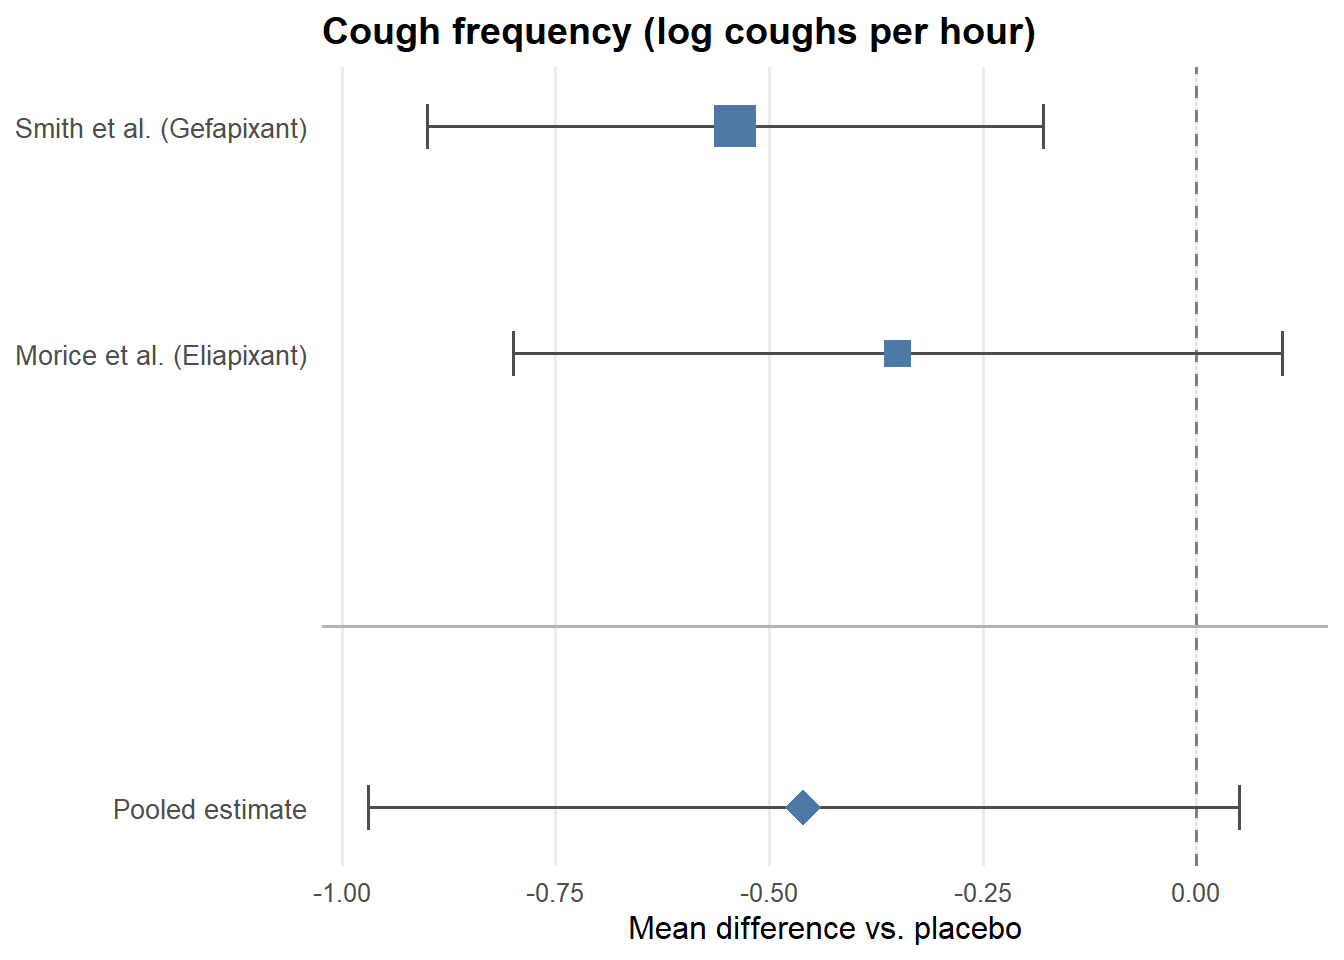
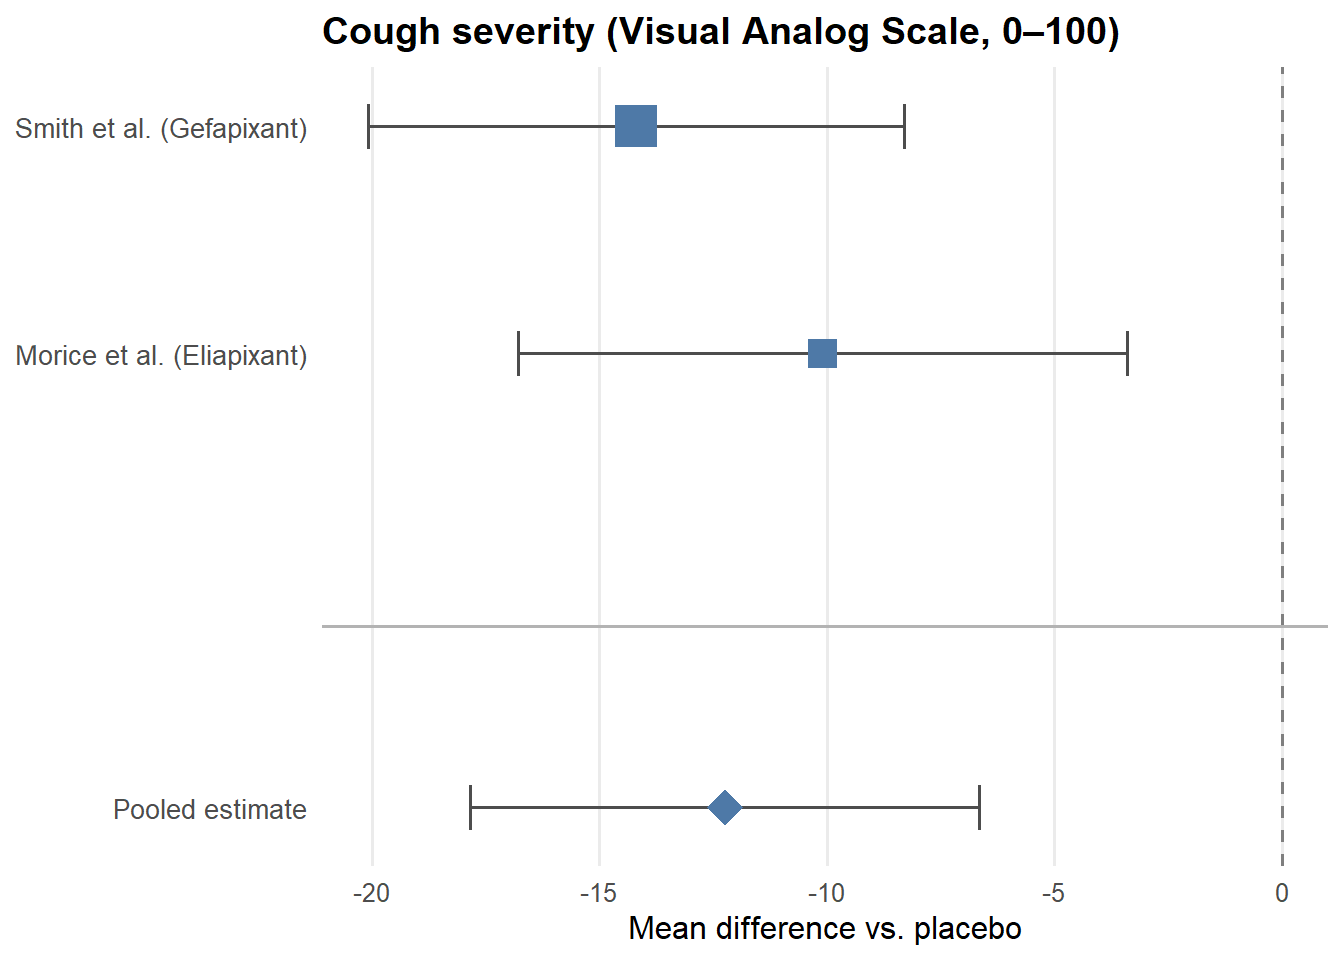
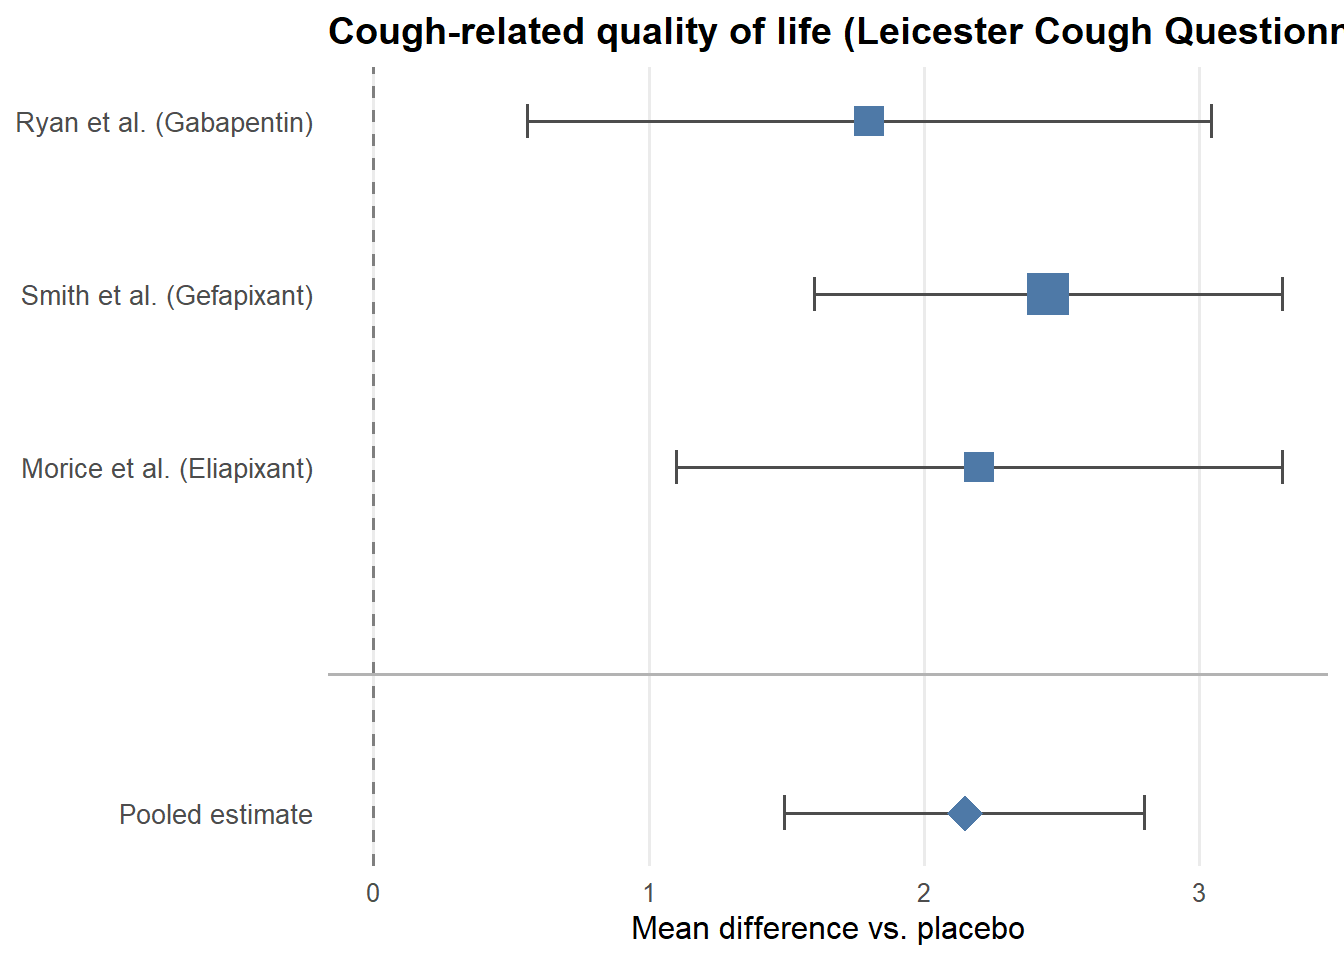
For each of the three outcomes, we fit a fixed-effects model using the inverse-variance method. Each study’s contribution to the pooled estimate is weighted by the inverse of its variance — larger, more precise studies receive more weight. This is visualized in the forest plots below, where the size of each square corresponds to the weight that study contributes to the pooled estimate.
Simulated data matching the published estimates are used here for illustrative purposes.
A useful lens for interpreting these results is the minimal important change (MIC) — the smallest effect that patients themselves would consider meaningful.
For the LCQ, the MIC is 1.3 points. The pooled estimate of 2.15 clears this threshold, suggesting a potentially meaningful improvement in quality of life. For the VAS, the MIC has been estimated at 13–17 points for acute cough; the pooled estimate of 12.24 falls just short of this range. For cough frequency, the confidence interval just crosses zero (95% CI [−0.97, 0.05]), meaning the result is not statistically significant.
Critically, these results do not straightforwardly support the drugs — they support uncertainty. The effects are modest, the confidence intervals are wide, and the studies are underpowered individually. This is precisely the researchers’ point: the evidence is insufficient to justify continued widespread off-label use, and a properly powered RCT is needed before stronger conclusions can be drawn.
The paper does not assess publication bias, which is a standard limitation to acknowledge in any meta-analysis. With only 3 studies, formal assessments such as funnel plots or Egger’s test are essentially uninformative — these methods require at least 10 studies to be interpretable. This is not a criticism of the authors’ choices so much as an inherent limitation of the literature: when so few comparable studies exist, publication bias cannot be ruled out and cannot be measured. It is plausible that null or negative results involving these drugs exist but were never published, which would mean the pooled estimates here are optimistic.
This engagement illustrated several realities of applied meta-analysis. First, the published literature is often not designed with pooled analysis in mind — incompatible outcome reporting, missing standard errors, and heterogeneous study designs can severely limit what is analyzable. Of 999 abstracts screened, only 3 met criteria for inclusion, largely due to reporting incompatibilities rather than clinical irrelevance.
Second, the two-week turnaround required clear division of labor. Clinical comparability judgments were handled by the domain experts; statistical comparability and analysis were mine. That boundary matters in consulting work.
Finally, the MIC framework is as useful for null or inconclusive results as it is for positive ones. Here, effects that barely clear or fall short of clinical significance are not a failure — they are evidence that the question remains genuinely open, and that a well-designed trial is the appropriate next step.